|
By: Donald R. Dengel, Ph.D. Originally Published in: Techniques Magazine Provided by: USTFCCCA
Not too long ago, I wrote an article (Dengel & Dengel, 2016) for Techniques for Track & Field and Cross Country on the importance of measuring body composition in track and field athletes. In that article, I discussed the pros and cons of various methods that can be used to determine body composition. In addition, I also presented the percent body fat values from a number of papers for male and female track and field athletes by event. Most of the methods used to determine body composition fall into one of two categories (i.e., two-component model and three-component model methods). These categories are determined by the number of compartments the method can actually determine. The simplest (and The three-component model methods of body composition are like the two-component model methods in that it measures fat mass; however, this method also measures both the bone mass and lean skeletal mass (i.e., muscle) separately. Common three-component model methods to determine body composition are dual X-ray absorptiometry (DXA), magnetic resonance imaging (MRI) and computed tomography (CT). Three-component DXA, like other three-component model methods of measuring body composition, determines total muscle, bone and fat masses, but it can also determine regional body composition (i.e., arms, legs, trunk, etc.). By measuring regional body composition, one can determine asymmetries between legs or arms in muscle, bone and fat masses. In addition, measuring regional body composition allows one to look at upper and lower body muscle mass ratios. These ratios are can be significant factors in the performance of certain sports.
Until recently, the DXA was mainly used At the time of the initial publication in Techniques for Track & Field and Cross Country on body composition in track and field athletes, there was very little body composition data in this population using three-component model methods of body composition. Therefore, the values presented in that article were from two-component model methods of body composition (i.e., skinfolds, hydrostatic underwater weighing). Since the publication of that article (Dengel & Dengel, 2016) a group of NCAA Division I Universities that utilize DXA to monitor body composition in their athletes pooled their data together to form the Consortium of College Athlete Research (C-CAR). Utilizing the C-CAR database, I recently wrote an MALE COLLEGIATE TRACK AND FIELD ATHLETES Beginning with the data from male track and field athletes first. All of the male track and field athletes had their body composition measured by DXA scanning that took place between September and December.
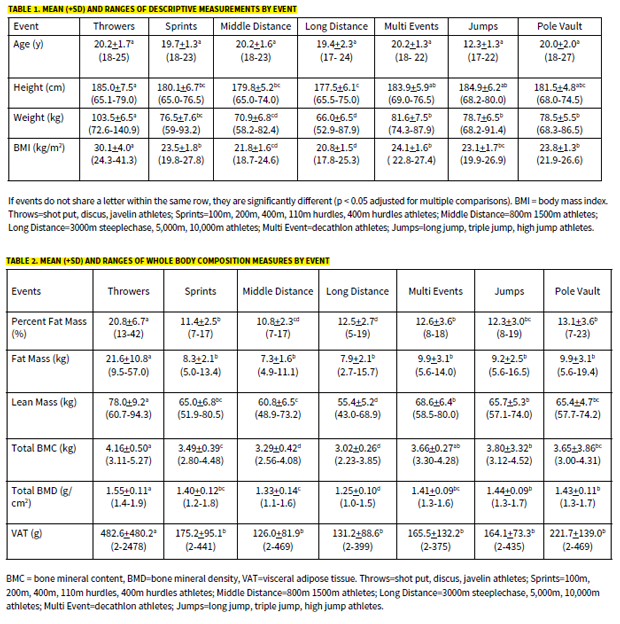
These male athletes were scanned from 4 different NCAA Division I Universities and were classified into one of seven categories: Jumpers (i.e., long jump, triple jump, high jump) (n=28); Long Distance Runners (i.e., 5,000, 10,000 meters and 3,000 meter steeplechase) (n=104); Middle Distance Runners (i.e., 800 and 1500 meters) (n=27), Multi-Event Athletes (n=11); Pole-Vaulters (PV; n=21); Sprinters (i.e., 100, 200 400 meters, and 100, 110 and 400 meter hurdles) (n=54); and Throwers (i.e., shot put, discus, javelin) (n=29). Multi-event athletes were individuals who competed in the decathlon (i.e., 100 meters, long jump, shot put, high jump, 400 meters, 110 meter hurdles, discus, pole vault, javelin and 1500 meters). Physical characteristics of male collegiate track and field athletes (Table 1). The physical characteristics (i.e., age, height, weight and body mass index [BMI]) of the male track and field athletes by event are compared in Table 1. By design, the male collegiate track and field athletes were of similar age across events. As expected, throwers were heavier than their counterparts. Based on standard body mass index (BMI) categories: sprinters, middle- and long-distance runners, jumpers, pole-vaulters and multi-event athletes would be classified as normal (BMI: 18.5-24.9 kg/ m2). Throwers on the other hand, would be classified as obese (BMI: 30.0-34.9 kg/ m2). Given the problem of using BMI to classify large athletes carrying high amounts of muscle mass seen in collegiate and professional football players (Bosch et al., 2019; Dengel et al., 2014) the classification of throwers as obese using this metric is not surprising. See Table 1
Total body composition measures of male collegiate track and field athletes (Table 2). In Table 2, the total body composition averages by event for the track and field athletes are presented. When these male track and field athletes are classified by total percent body fat (%fat), throwers would be considered overweight (%fat: 21-24%) while male sprinters, middle- and long-distance runners, jumpers, pole vaulters and multi-event athletes would be classified as good (%fat: 11-14%) (Jeukendrup & Gleeson, 2019). None of the male track and field athletes were considered athletic (%fat: 5-10%) (Jeukendrup & Gleeson, 2019). It is important to note that these classifications were based on two-component body composition methods (i.e., hydrostatic weighing and skinfolds), while the current study's values were produced from a three-component body composition method (i.e., DXA). As I previously mentioned, the two-component model of body composition has to assume mass of the bones, while a three-component model of body composition actually measures the mass of the bones. This improves the accuracy of the three-component method body composition over the two-component method of body composition. Typically, athletes will have a higher percent fat when it is measured using a three-component method versus a two-component method and issues of comparing athletes using different methods. Table 2 also contains the bone mineral content (BMC) or bone mass values for male track and field athletes. Not surprising is the fact that male long-distance runners had lower total BMC in comparison to their track and field counterparts, while male throwers had significantly greater total BMC. This illustrates the problem with assuming that the bone mass for athletes or anyone is the same. There are a number of different factors that can affect the bone mass (BMC), and therefore assuming everyone has the same BMC can lead to error in accuracy. See Table 2
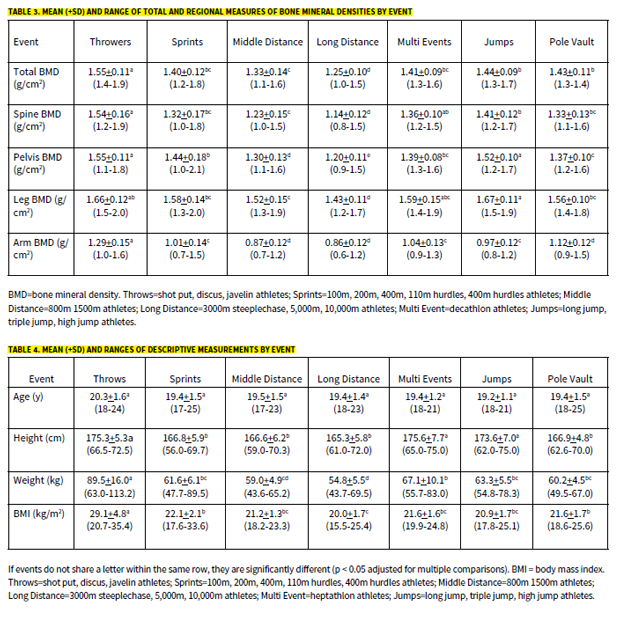
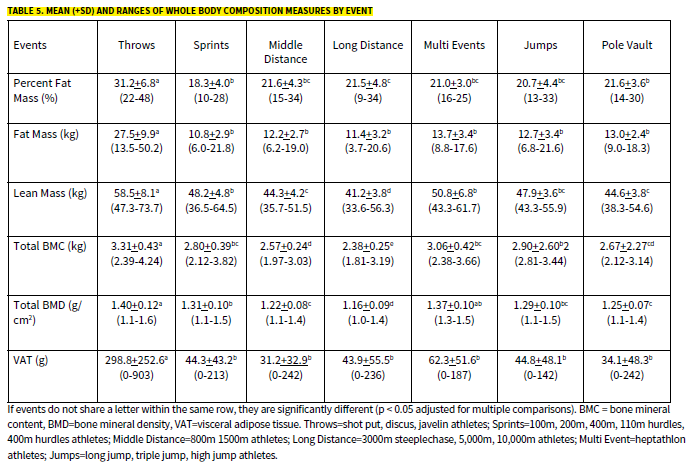
Total and regional measures of bone mineral density for male collegiate track and field athletes (Table 3). Mean total and regional measures of BMD for male track and field athletes are presented in Table 3. BMD is the amount of bone mineral in bone tissue. While BMC and BMD sound like the same thing, they are really two different measurements. For example, two athletes, who weigh the same but are different in regards to height, may have identical BMC values for their total body or for a particular region of the body. However, the shorter athlete may have a higher total BMD when compared to the taller athlete, who weighs the same. BMD is often used clinically to assess risk of osteoporosis. While a very low BMD doesn't predict a fracture, it may indicate if an individual is at a greater risk for a fracture. A low BMD is often observed in athletes with a low total body mass. The data presented in Table 3 shows that the total BMD measurements for long distance runners was significantly lower than BMD values for other male track and field athletes. Throwers, on the other hand, had significantly greater total BMD values compared to their male track and field counterparts. This is not surprising given that their overall size and the amount of stress placed on the bones by the training required by their event. For most regional (i.e., spine, pelvis, leg and arm) measures of BMD, throwers had significantly greater BMD values, while long distance runners had significantly lower regional BMD values than their track and field counterparts. See Table 3 FEMALE COLLEGIATE TRACK AND FIELD ATHLETES All of the athletes had their body composition determined by DXA and were scanned from 4 different NCAA Division I Universities and were classified into one of seven categories: Jumpers (i.e., long jump, triple jump, high jump) (n=30); Long Distance Runners (i.e., 5,000, 10,000 meters and 3,000 meter steeplechase) (n=110); Middle Distance Runners (i.e., 800 and 1500 meters) (n=24); Multi-Event Athletes (n=9); Pole-Vaulters (PV; n=27); Sprinters (i.e., 100, 200 400 meters, and 100, 110 and 400 meter hurdles) (n=96); and throwers (i.e., shot put, discus, javelin) (n=20). Multi-Event Athletes were individuals who competed in the heptathlon (i.e., 100 meter hurdles, long jump, shotput, high jump, 200 meters, javelin and 800 meters). All DXA scans were done between September and December. Physical characteristics of female collegiate track and field athletes (Table 4). The physical characteristics (i.e., age, height, weight and body mass index [BMI]) of the female athletes by event are compared in Table 4. As with the male track and field athletes, the female athletes had a similar age across events. In looking at just total body weight, as you would expect, throwers were heavier than their counterparts. Based on standard body mass index (BMI) categories: sprinters, middle- and long-distance runners, jumpers, pole-vaulters and multi-event athletes would be classified as normal (BMI: 18.5-24.9 kg/m2). Throwers, on the other hand, would be classified as obese (BMI: 25.0-29.9 kg/m2). This is exactly what we saw in the male track and field athletes. Again, the fact that throwers were classified as obese is not too surprising and illustrates the problem with using BMI as a way to classify athletes, especially those athletes that are large and carry a lot of muscle mass. See Table 4
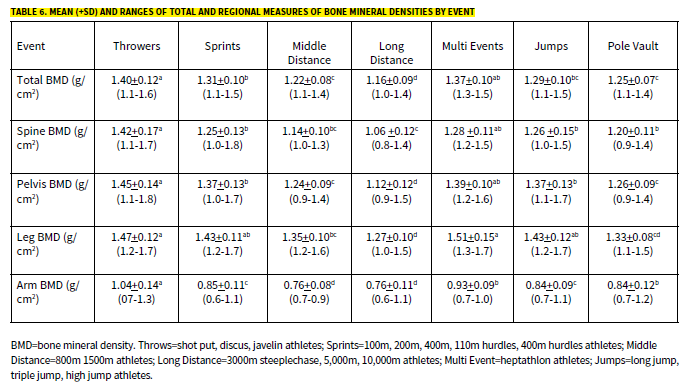
Total body composition measures of female collegiate track and field athletes (Table 5). In Table 5, the total body com-position averages by event for the female track and field athletes are presented. When these track and field athletes are classified by total percent body fat (%fat), female throwers would be considered overweight (%fat: 31-36%), while female sprinters, middle- and long-distance runners, jumpers, pole vaulters and multi-event athletes would be classified as normal (%fat: 16-23%) (Jeukendrup & Gleeson, 2019). None of the female track and field athletes were considered athletic (%fat: 8-15%) (Jeukendrup & Gleeson, 2019). This was exactly what we saw in the male track and field athletes when we examined their percent fat values by event. The same issue holds true for the female track and field athletes. It is important to note that these classifications were based on two-component body composition methods (i.e., hydrostatic weighing and skinfolds), while the current study's values were produced from a three-component body composition method (i.e., DXA). Table 5 also contains the total weight of the bones (BMC: bone mineral content) for our female track and field athletes. Not surprising is the fact that female long-distance runners had a lower total BMC in comparison to their female track and field counterparts, while throwers had a significantly greater total BMC than their female counterparts. This trend is exactly what we observed for total BMC in our male track and field athletes, illustrating the problem with assuming that the mass of bones for athletes, or anyone for that matter, is the same. There are a number of different factors that can affect the mass of bones [BMC] and therefore assuming everyone has the same BMC can lead to error in accuracy in percent fat when using a two-component method to measure body composition. See Table 5 Total and regional measures of bone mineral density for female collegiate track and field athletes (Table 6). Mean total and regional measures of BMD for female track and field athletes are presented in Table 6. As with the male track and field athletes, the total BMD measurements for long distance runners was significantly lower than BMD values for other female track and field athletes. Again, throwers had significantly greater total BMD values compared to other female track and field athletes, except sprinters and multi-event athletes. For most regional (i.e., spine, pelvis, leg and arm) measures of BMD, throwers had significantly greater BMD values, while long distance runners had significantly lower regional BMD values than their track and field counterparts. These same trends in both total and regional BMD were observed in our male track and field athletes. For females, the concern regarding BMD is long distance runners should be of concern. As we pointed out, a low BMD does indicate who will develop a stress fracture, but it is a good indicator of osteoporosis and can be used to monitor an athlete's bone health. See Table 6 What does it all mean? As this article points out, there are some significant total and regional body composition differences across events for female track and field athletes. These differences may be due to the unique demands of each event. The data provides a guide for coaches and trainers when evaluating both male and female track and field athletes. It also points out how serial measures can be used to monitor an athlete's body compositions as well as bone health. As complete as this article is regarding body composition in track and field athletes, one should not consider this the end to the discussion on body composition in male and female track and field athletes. There is still room to expand upon this study by examining seasonal changes in body composition within this athletic population. This may prove to be very interesting, given that a lot of long distance athletes also compete in cross-country in the fall and transition into indoor track during the winter and outdoor track in the spring, while some athletes only compete in the winter indoor and spring outdoor track seasons. Following these different athletes will provide trainers and coaches with more information to make adaptations to training throughout the competitive season for track and field athletes by event. CONCLUSION In summary, while an athlete's body composition may help to optimize their performance in a given sport, it is important to remember that the purpose of this article is to act as a guide concerning body composition in track and field athletes, not as a strict template for each individual athlete. It is our hope that this article will provide coaches and athletes with a reference, but in the end, it is important to remember that track and field athletes come in a variety of shapes and sizes and, ultimately, body compositions. DISCLAIMER The information provided in this article should not take the place of medical advice. Any specific questions should be directed toward appropriate health care providers (medical doctors, pharmacists, registered dieticians, etc.). REFERENCES Bosch TA, Carbuhn A, Stanforth PR, Oliver JM, Keller KA, Dengel DR: Body composition and bone mineral density of division 1 collegiate football players: a consortium of college athlete research study. Journal of Strength and Conditioning Research 33(5):1339-1346, 2019. Dengel, DR, Bosch TA, Burruss TP, Fielding KA, Engel BE, Weir NL, Weston TD: Body composition of National Football League players. Journal of Strength and Conditioning Research 28(1):1-6, 2014. Dengel DR, Dengel OH: Body Composition: Methods and importance for performance and health. Techniques for Track & Field and Cross Country 9(4):30-43, 2016. Dengel DR, Keller KA, Stanforth PR, Oliver JM, Carbuhn A, Bosch TA: Body composition and bone mineral density of division 1 collegiate track and field athletes, a consortium of college athlete Jeukendrup A, Gleeson M. 2019 Sport Nutrition. 3rd ed. Champaign, IL: Human Kinetic; 2019. DONALD R. DENGEL, PH.D., IS THE HENRY L. TAYLOR-ARTHUR S. LEON PROFESSOR IN EXERCISE SCIENCE AND HEALTH ENHANCEMENT IN THE SCHOOL OF KINESIOLOGY AND THE DIRECTOR OF THE LABORATORY OF INTEGRATIVE HUMAN PHYSIOLOGY AT THE UNIVERSITY OF MINNESOTA. |


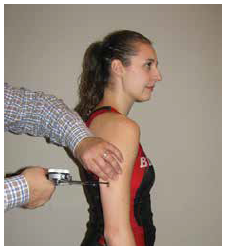 typically the cheapest) methods to measure body composition fall into the two-component model to estimate body composition. These methods place the total body mass of an individual into two separate components: the first component being the amount of fat mass in the body and the second component consisting of the amount of fat-free mass contained in the body. The second component (i.e., fat-free mass) combines bone and muscle into the same value. Common two-component body composition methods are hydrostatic underwater weighing, bioelectrical impedance (BIA), skinfolds, air displacement (BodPodTM), and circumference measures.
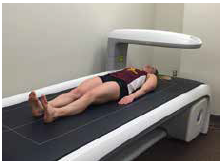 methods of determining body composition are typically expensive and over the measurement of total body composition are not practical. Of the three-component model methods to determine body composition, the DXA is by far the most widely utilized method.
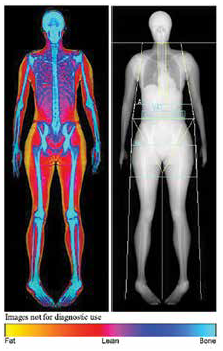 Although bone does not typically account for a great amount of the total body mass of an individual, by actually measuring bone mass, three-component model methods have greater accuracy than the two-component model methods of measuring body composition. Being able to measure bone also allows one to determine bone mineral density, which is important in individuals and athletes who may be at risk for low bone mineral density and possibly stress fractures, etc.
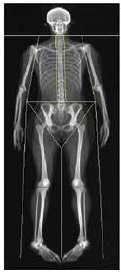 article on body composition in NCAA Division I Universities track and field athletes that was published in the Journal of Clinical Densitometry (Dengel et al., 2020). At the time, the C-CAR database consisted of 590 male and female track and field athletes. Due to the large number of athletes tested, we were able to examine these athletes by sex and event. In addition, by using DXA to determine body composition, we were able to go beyond the original papers used to write the initial article that appeared in Techniques for Track & Field and Cross Country that had only used two-component model methods to measure body composition. We were able to separate the measure of fat-free mass into lean skeletal muscle and bone masses. Further, we were able to examine the bone mineral density of these athletes. It is important to remember that the data contained in that paper is on NCAA Division I Collegiate male and female track and field athletes, so caution should be taken when applying these values to high school athletes who are younger and less developed. There is a wealth of data in the article (Dengel et al., 2020) and I encourage you to read it if you want more detailed information. To help summarize the data contained in that article I am going to examine the data in males and female track and field athletes separately. I will present the data as mean (average value) + standard deviation as well as the range ranges (high and low) for each value.