| Approach Velocity - The Factor That Most Influences Long Jump Performance |
| By: Quincy Howe
Originally Published in:Techniques Magazine Provided by: USTFCCCA Even though we are mostly aware that faster velocities attained on the runway typically yield further jump distance, my goal is to put hard numbers to this theory so as to support the hypothesis that increased approach velocity results in increased jump distances. I also seek to potentially eliminate some other factors that may or may not have as much to do with jump distance as previously thought. Data collection at track and field events requires quite a bit of equipment and can be intrusive during a time when coaches, as well as athletes, rarely tolerate intrusion. As a result, there is a very limited number of these studies conducted, especially not in the midst of an actual competition.
The few studies that are out there typically use athletes at elite competitions like the IAAF World Championships or Olympic Games. These athletes are in the 99th percentile of participants in the long jump event. I believe that studying median performers in the event would yield results that would be more relatable to a wider population. This article will examine the later rather than the former, hopefully proving to be a useful tool for a broader spectrum of coaches to refer to when preparing their jumpers. METHODOLOGY All jumps were recorded at 120 frames per second. The camera was placed 10m away from the takeoff board in line with the foul mark. All jumps were filmed with a panning action and jumpers were filmed laterally. Video from four male and four female collegiate long jumpers of varying ability and experience were analyzed for a total of 26 jumps. The following are all the steps taken to collect data: Approach velocity: four landmarks were measured along the runway, they were all measured from the long jump foul line. These marks were at 5.76 meters, 5.96 meters, 8.81 meters and 9.01 meters. These arbitrary marks were chosen because they were known marks on the runway that have already been established. In order to get an accurate measurement, the subject had to hit one of the four designated marks. From that point, frames were counted all the way to the touchdown on the takeoff board. Since we know that there are 120 frames every second, we can determine the elapsed time for a known distance thereby resulting in a velocity. This velocity is an average velocity of the last 3 or 4 steps of the long jump approach, depending on which landmark was hit during the approach. Trials were eliminated if an athlete did not hit one of the four marks previously designated above as well as not hitting any part of the 20cm takeoff board or foul jumps. As a caveat, the calculated velocities using the above method were found to be 0.4 - 0.6 m/s faster than a traditional 11m-lm gated velocity using a Free Lap timing system. This was because the foot contacts during the last two steps fell ahead of the subject's COM. However, I felt the need to have a larger sample size for data collection. I also believe that even though the true approach velocity differed from the calculated velocity, the relationship within the study group remains consistent and can be related to other factors within this specific study group. Example: V - approach velocity in m/s F - video frames D - distance in m Fr - Frame rate in frames per second T - Time V=D ÷ (F/Fr) V=D ÷ T
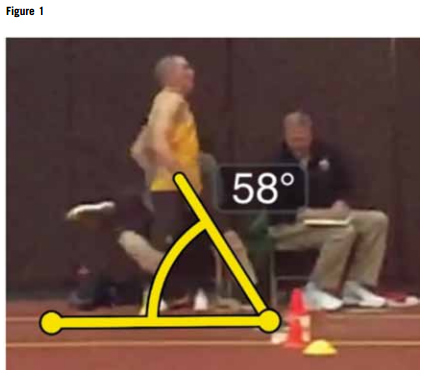
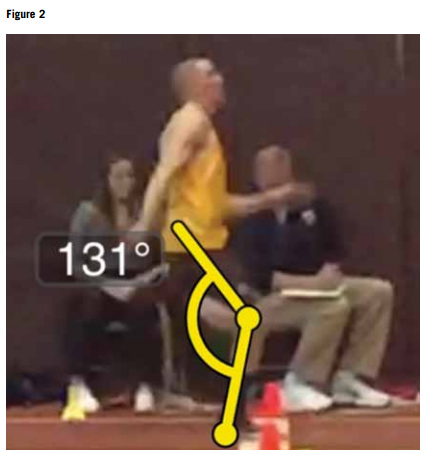
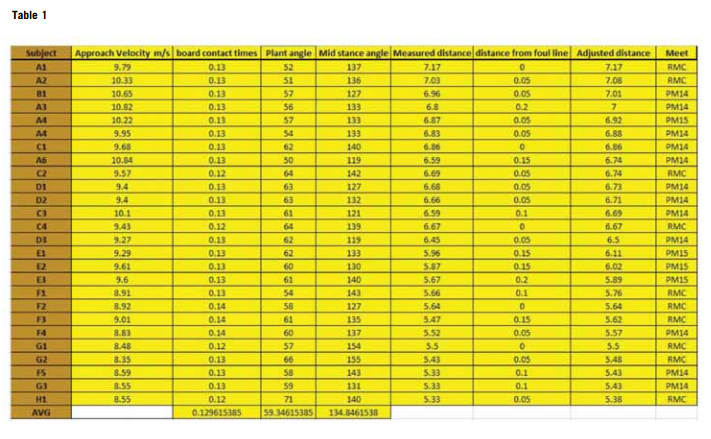
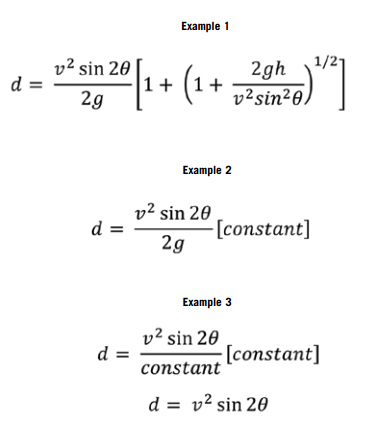
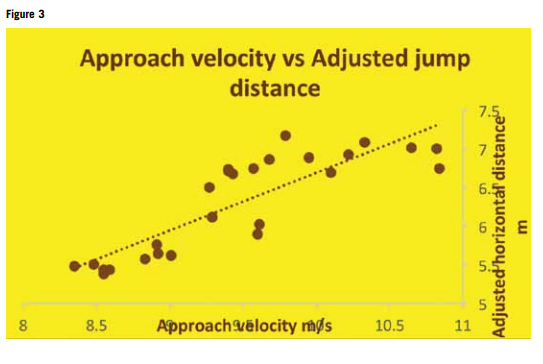
Board contact time: Similar to collecting data for the approach velocity, frames were counted from touchdown to toe-off of the takeoff board. This number was then used to calculate the ground contact time. Example: T = F ÷ Fr Plant angle: A freeze frame was analyzed and the plant angle was taken from the hip to the ankle joint and the ground. (See figure 1) Midstance angle: I denoted midstance for this study as the frame in which both knees are in line with each other during the support phase of the takeoff leg. At this point, the knee flexion angle of the takeoff leg is pulled from hip to knee to ankle joints. (See figure 2) It has shown that most of the subjects had their greatest knee flexion at this point in the jump. Adjusted jump distance: All the data collected came from actual competitions. Therefore I was limited by the confines of meet rules and procedures. As a result, in order to collect real jump distances as well as measured jump distances, I had to formulate a grid at the jump board. The grid had five measurements: 0, 5, 10, 15 and 20 cm, which spanned the entirety of the jump board. These numbers were then added to the corresponding measured jumps for an actual jump distance. There is an inherent margin for error since the numbers are pulled from a video but this margin is negligible, and I don't believe it affected the outcome of this study. RESULTS Table 1 shows all of the collected data. CONCLUSION Approach velocity vs adjusted jump distance: The results found in this study yielded a strong relationship between approach velocity and actual jump distance. Referring to figure 3, you can see that the correlation between the two is positive and quite obvious. Using the equation of range of a projectile in flight, we can show that flight distance is most influenced by the takeoff velocity which is a vector of the approach velocity. (See example 1) d is the jump distance v is the takeoff velocity is the angle of takeoff g is the acceleration due to gravity h is the change in takeoff height and landing height of the center of mass
Looking at the above equation, h will remain the same for an individual jumper, give or take a few cm regardless of takeoff velocity or take of angle, provided that the jumper is executing a competition level approach run. For this reason, the h can be considered a constant regardless of the other variables. Acceleration due to gravity can also be considered a constant variable as well since its change is minuscule at 9.81 m at sea level and 9.77 m on the top of Mount Everest. This reduces the above equation to below: (See example 2) Looking at the reduced equation, it can be seen that takeoff velocity is raised to the power of 2, thereby being the greatest driving factor in determining jump distance d. There is the variable of takeoff angle that will also influence jump distance. Therefore, even though there is a correlation between takeoff velocity and jump distance, I am not yet ready to say that there is causality. (See example 3) v2 will always yield a higher number. For example, practical numbers for are 0-45 degrees, yielding numbers of 0-1. Whereas having practical numbers in this study of 8.35 to 10.84, yielding numbers of 69.72 to 117.51. See Figure 3
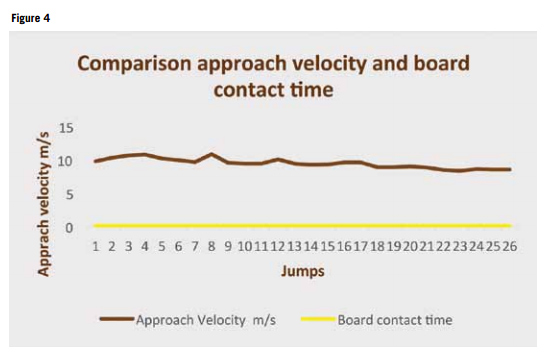
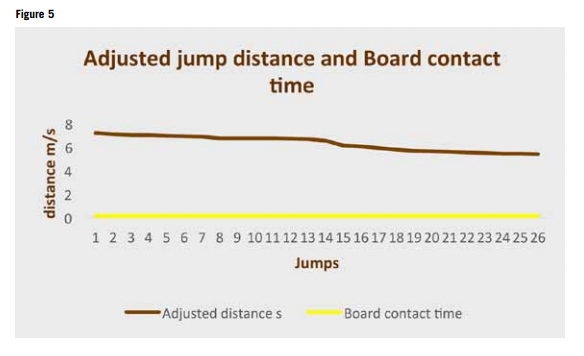
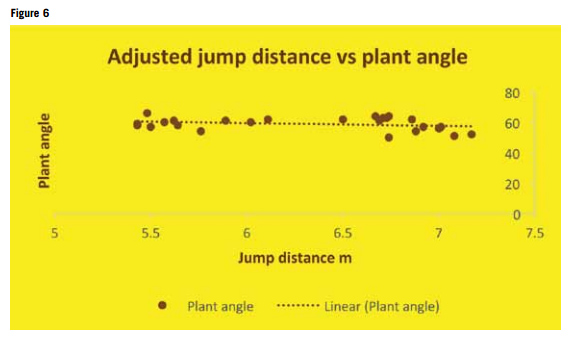
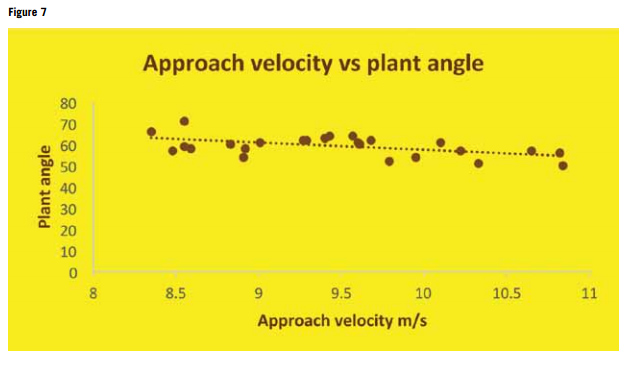
Board contact time: Looking at board contact times across the spectrum of gender and jumping ability, I found that there was not a significant difference in these times. They ranged from 0.12s to 0.14s but was overwhelmingly 0.13s. The same results can be seen in relation to approach velocities. (See Figures 4 and 5) Plant angles: Over the 26 jump attempts, with actual jump distances ranging from 5.38m to 7.17m and across genders, the difference in plant angles were negligible and averaged out to 59.12 degrees, 60.58 degrees for women and 58.29 degrees for men. Cross referencing these numbers with elite jumpers, the same 2-degree average difference was observed in this sample set. See Figures 6 & 7
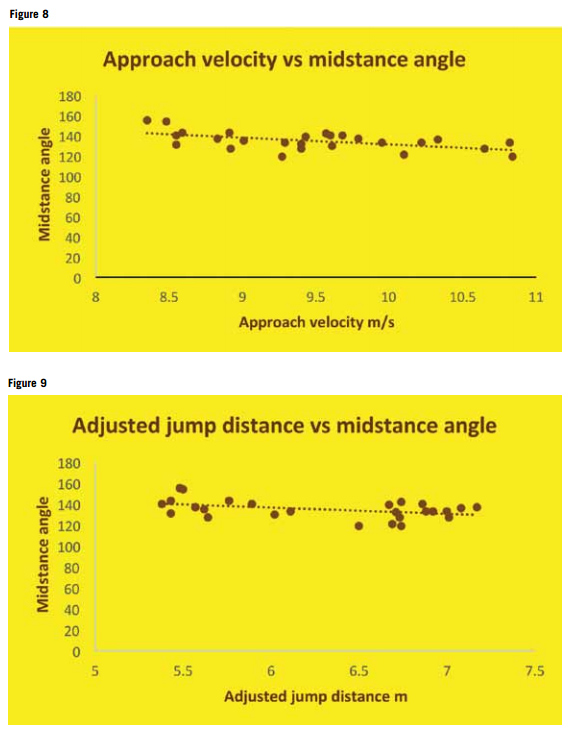
Figure 7 Midstance angle: this was denoted by the greatest flexion angle before takeoff. It was observed that these numbers weren't significantly different across genders and ability levels as well. See Figures 8 & 9 OPINION Midstance angle: I believe that the midstance knee flexion before takeoff is a byproduct of the approach velocity, plant time and plant angle. I don't think that it is something that can be coached and improved to result in better jump distances. Figures 8 and 9 above already show that regardless of jump distances, the change in knee flexion is nominal. It is definitely data that cannot be easily collected analyzed and relayed back to the athlete in a training session or in competition in a timely manner. It would be my suggestion that this data set be left alone and not used when training long jumpers. It has shown that there is a range that has to be obtained in order to achieve successful jumps.
Board contact times: The difference between elite jumpers and non-elite competitors is as small as .02s. The data that I collected had an average of 0.13s with the range being .11s - .14s. At the IAAF World Championships 2009, the elite jumpers at that competition had an average contact time of 0.12 for men and 0.13s for women. There is definitely a range that absolutely needs to be attained in order to attain successful longer jumps. It is my opinion that being able to attain contact times of between 0.11 and 0.13s is absolutely crucial, but force generated and the direction of that force generation, as well as the transfer to vertical velocity, will have a greater influence on the jump distance than board contact times. Since the results have shown that the ground contact times across age, gender and ability level in this study remained essentially constant, then it would be reasonable to assume that the force produced and the direction of that force production would have a much greater variance which could influence jump distance. A follow-up study with force plates at the jump board could shed a great deal of light on the influence of force production. Plant Angle: Similar to midstance angle, this is also a byproduct of approach velocity as well as ultimate step distance from the takeoff board. The average plant angle for the 26 trials was 59.18 degrees. There was not much of a trend relative to approach velocity or jump distance. I believe that anthropometric differences in leg length among the 8 athletes may have contributed to the slight changes in angles. Knowing that an optimum plant angle is crucial to a successful jump and knowing that its relationship closely coincides with ultimate step distance, I would devise a penultimate step 'strike zone' during training, so that each athlete is able to hit an optimum position for each individual that is unique. This is typically 1.85m for women and 2m for men. This is a starting point and definitely has to be adjusted to suit each athlete's approach speed as well as their leg length (hip to heel). Approach velocity: From the data collected, as well as the projectile in flight equation, we can see that approach velocity has the greatest influence on jump distance. If there is a hierarchy of importance when preparing for the event, acceleration and takeoff velocity must be the top of the list. Across the ability levels as well as gender, greater approach velocity in turn resulted in greater jump distance. We also have to remember that during takeoff, velocity has a horizontal component as well as a vertical component. Even though this study did not touch on the vertical component of velocity, we can assume that a higher vertical component of velocity will also yield longer jump distances. This in and of itself can fuel another lengthy study. This study has confirmed what the hypothesis originally stated that big approach velocities result in big jump distances. So run fast, plant hard and fast, and jump far!
REFERENCES Adamantios (1997) Biomechanical analysis of the long jump R. McN Alexander (1990) Optimum take-off techniques for high and long jumps J.G. Hay (1986) The techniques of the elite male long jumpers Helmar Hommel (2009) Biomechanical analysis of selected events at 12th IAAF world championships in athletics Howe (2005) the effect of individual strength differences on the relationship between strength training, muscle fiber length and maximum vertical jumping performance in trained jump athletes ( unpublished thesis) Meinecke S. Review and editing Nicholas P. Linthorne (1999) biomechanics of the long jump Boo Schexnayder Sac speed. Email correspondence Seyfarth (1999) dynamics of long jump Seyfarth (2000) optimum take-off techniques and muscle design for long jump Quincy Hayden Howe is beginning his 12th year at the University of Wyoming where he coaches horizontal jumps and high jump. Howe has coached 14 conference champions at Wyoming, as well as 6 All Americans. He was a 2 time All-American in the Triple Jump for Wyoming and still holds the indoor Triple Jump record for his native Trinidad and Tobago. |


