| Perceived Performance: Highest Effort Doesn't Always Equal Highest Performance |
| By: Dave Nielsen
Provided by: USTFCCCA Originally Published in: Techniques Magazine
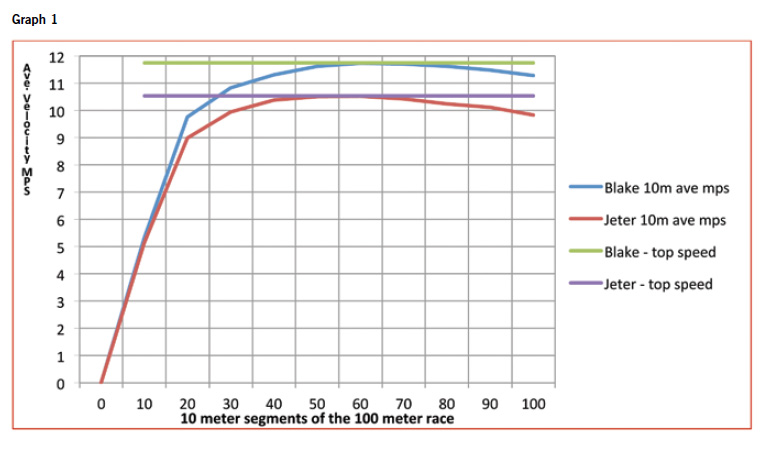
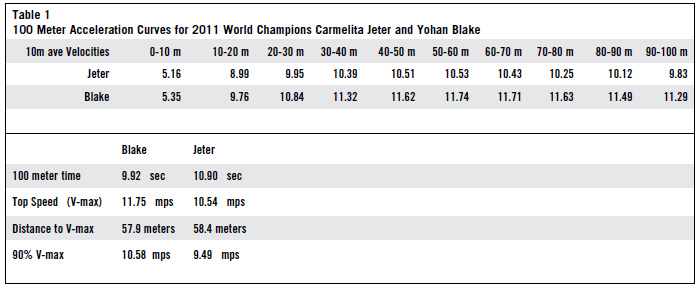
Any given performance requires some sort of effort. Generally, higher level performance requires more effort and vice versa. Many times the leap of logic is to assume the highest (perceived) effort must indicate the highest level of performance. This can be problematic in both training and performance as mind and body can be fooled into connecting too closely effort and performance. The following is a discussion of this principle taken from the insights of Dr. Manfred Steinbach. Dr. Steinbach was a very talented German athlete. A two time Olympian, he competed in the 100 meters at the 1956 Olympics. In 1960 he finished 4th in the Olympics in Rome by long jumping over 8 meters (that's 26' 2.25" for the metrically challenged). The same year he posted a mark of 8.14 meters besting Jesse Owens 25 year old record but lack of wind measurement kept the mark from being ratified. This great athlete was also blessed with superior intellect and insight. Dr. Steinbach is a physician (neurologist), a professor of sports medicine, and enjoyed an impressive career of service to government and sport. The premise, to be short, is that effort and fatigue can confuse a person as to the quality of performance. I think this is a universal message extending far beyond sprinting. However, my first goal is to present this as a sprinting concept. To this end, let's imagine someone sprinting 100 meters. Using an axiom I remember from my sport science classes of some 40 years ago, most people accelerate to about 90 percent of their maximum velocity in 20 meters (about 65 feet). In almost all cases, it takes less than 6 seconds for a person racing from a stationary position to top speed. Depending on the athlete's top speed and training experience, top speed is realized between 35 - 70 meters on average. Graph 1 displays 100 meter velocity curves of Yohan Blake's and Carmelita Jeter's 2011 World Championship performance. The average velocity per each 10 meter segment (in meters per second) is displayed on the "Y" axis. The "X" axis is meters of the race run. Table 1 is the data used to generate the graph. See Graph 1.
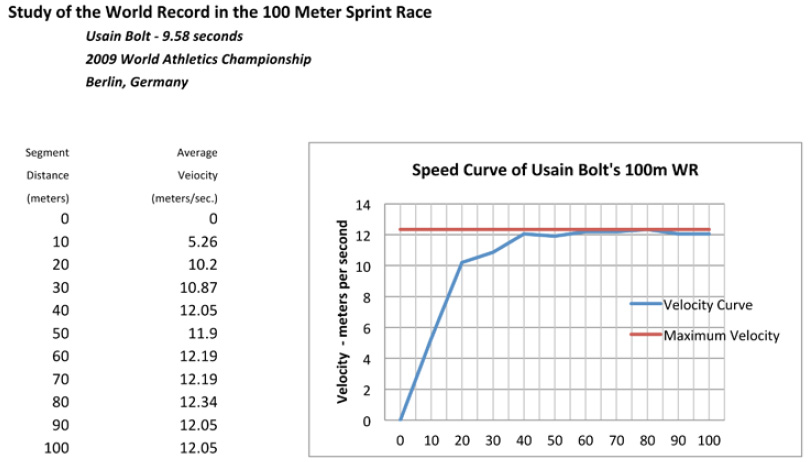
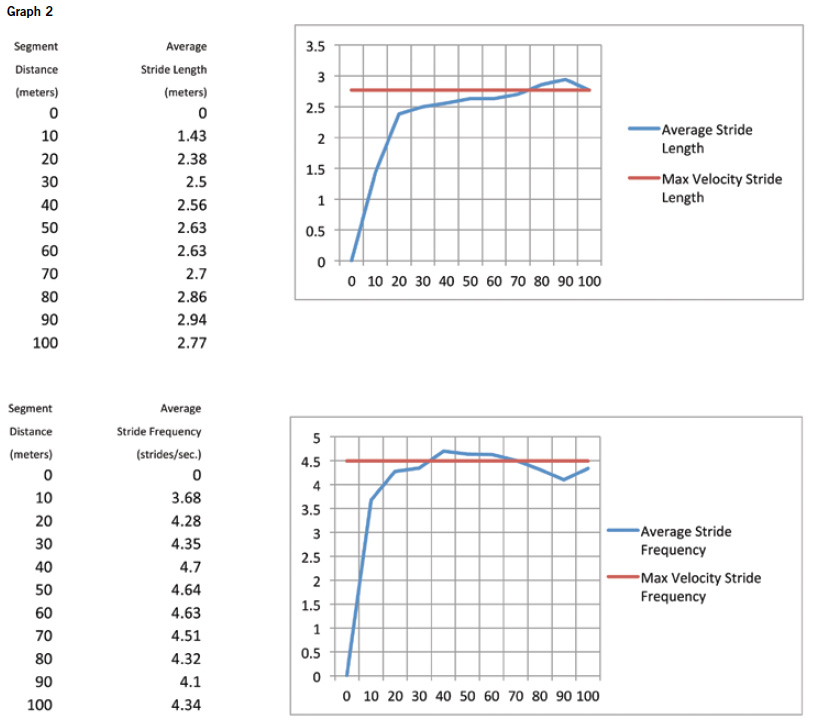
The development of speed is a premium. Not surprisingly the World Record holder displays incredible speed and fitness. His velocity average for the last 60 meters of the race was in excess of 12 meters per second. Stride length in the last 40 meters of the race averaged over 2.8 meters (9 foot 2 inches)! His speed endurance is also exceptional slowing less than 2 percent in the final 20 meters as compared to his peak average velocity between 60 and 80 meters. However, it is notable that changes in running did occur in the final "slowing" 20 meters. Stride length increased and stride frequency decreased in the final 20 meters. This represents his final mechanics as other than that of his peak speed mechanics. In point, I am sure the effort was at peak level during the final 20 but velocity, stride length, and stride frequency were not the same. The considerations here are effort and the changes that occur once the athlete has achieved top speed. As seen above, the pattern of running changes after the athlete achieves top speed whereas the effort likely remained the same. Once achieving top speed the remaining effort revolves around speed endurance. Speed endurance is certainly a critical training component but is not the same as speed development. For speed development, the athlete needs to have a feeling of "head-room" to run faster and to sense that he or she can run faster. Or, when "hitting" that top speed, get a feel of ease or relaxation while moving very fast and then "shut it down." In this way, they have saved energy for another opportunity to sense and experience the same pattern in the next repetition. It is important to recognize, for both coach and athlete that "top speed" varies day to day and repetition to repetition. Speed development activities should be devoted to building up to a high rate of speed and not to the effort of hanging on as changes in running mechanics occur. Running velocity is the product of stride length and stride frequency. The primary factors in determining the magnitude of each are force applied to the ground, direction in which force is applied, duration of the application, and frequency of the application. Sprinting is quite a challenge as legs and arms make many rotational cycles in a very short period of time. There must be a reciprocal action of antagonistic and agonistic muscles and occurring repeatedly in a very short period of time. In other words if I use my hip extensor to drive my leg down to push on the ground, my hip flexor needs to relax or it will inhibit the action to push. Meanwhile, the other leg must be doing the opposite and this rapid changing occurs more than four times a second in most all sprinters. Steinbach pointed out that the elite sprinters were the ones gifted with a neural system that was very adept at handling the high speed transfer of signals. Training for speed development is to then to involve training these neural pathways so that they can carry messages to the muscles more quickly and effectively - to both contract and relax.
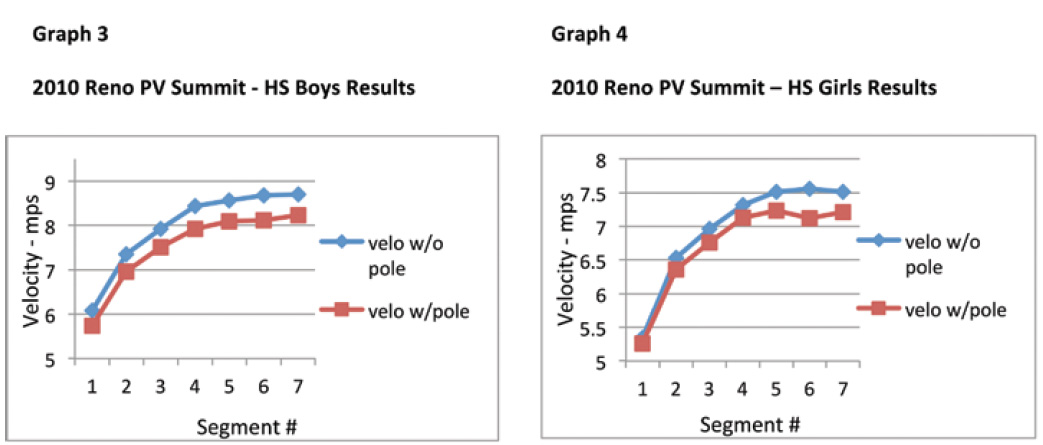
Training activities for speed development should include running which brings the athlete up to or near top speed but not going to the point that effort exceeds performance. The point where effort exceeds performance is seen in the graphs above (Graph 2) as changes in stride length and frequency disrupting the optimal speed balance. Training for speed development should therefore be centered up to and at the optimal balance of stride length, stride frequency, and the contraction/relaxation cycles. Avoiding neurological and physiological fatigue in top speed development is wise so as not to jaundice the athlete's perception of actual performance. Training that Dr. Steinbach suggested are build ups, fly ins, and "ins and outs" at appropriate distances as suggested by the graphs above. He points to the development of speed in American foot ball players, especially wide receivers, as a great vehicle for speed development and may be at least partially due to the success the USA has in the sprints. Build ups of 30 to 60 meters seems to be an appropriate range. The length of the" build up" is dependent on the athlete's current ability on a daily and chronological basis. After the athlete reaches a running velocity where he or she struggles or at least is just maintaining the speed they are running, the athlete should relax and shut it down. The fly in is where the athlete takes a running start into a measured segment where they try to run at a high rate of speed for that distance. Generally, the more intense the effort the shorter the segment length should be. A longer fly in can be considered more as speed endurance whereas the shorter fly in geared more to speed development. "Ins and outs" are build ups to a high rate of speed followed by a relaxed segment and then another build up to high speed and then immediate shut down. This can be done as an exercise totally controlled by the athlete on their "feel" or by organizing the effort by defining the length of each segment. An example of the latter is to mark off three ten meter segments. The athlete has a running start to the first segment so that he/she reaches a high rate of speed entering the first segment. They run very fast for the first ten meters. The second ten meters the athlete relaxes slightly, akin to pushing in the clutch on the car, so that they are still going very fast but with seemingly little effort. They then speed up through the last ten meter segment (in this case about four steps) followed by a gradual shut down. It is important to note that the middle section of the "in and out" is as important as the other two as it trains the perception of relaxation and speed. Recognition of the level of athlete is important for proper exercise prescription. Graphs 3 & 4 are velocity curves for averages of boys and girls test run performances at the Reno Pole Vault Summit in 2010. My team of college athletes tested this group of high school attendees at the 2010 Reno Pole Vault Summit. The subjects were given a 3 meter run in to seven timed five meter segments measured with photo electric timing gates. They ran one trial carrying a pole and one trial without carrying a pole. The total distance run for this study was 38 meters, a little over 40 yards. Note the acceleration curves are quite similar to the elite athletes above but with a considerably slower top speed. By the third segment (18 meters) both girls and boys had accelerated to 90 percent of their top speed. The girl's average clearly shows they have reached top speed. The boy's average on the graph suggests they may have reached top speed a little later but were at least very close. By noting the velocities, the time to this "top speed" was in excess of five seconds. This is presented to suggest appropriate training for younger or less skilled groups. See Graph 3 and Graph 4.
CONCLUSION The principle of perceived performance suggests that if the link between effort and performance is too strong athletes can be fooled into confusing the two as one. This confusion generally takes place when fatigue, high effort and a lowered performance level are occurring simultaneously. Further, repeated bouts within multiple sessions and over time, can hinder the ability to improve performance as one begins to identify peak performance at a lower level. While this is not irreversible, it slows improvement or attainment of a higher level. It should be noted that this principle is not intended to diminish the value of endurance or enhancement thereof. It serves, in this example, as a clarification of specificity regarding speed training. Further, I think this concept can be broad based in application from athletics to life pursuits. A short succinct article by Dr. Steinbach served as my primary reference for writing "The Principle of Perceived Performance." This article, which I am not unable to find, was required reading by my mentor Peter Tegen, USTFCCCA Hall of Fame Coach, when I served as his assistant at Wisconsin. The principle remains with me though and worth sharing. The data for Blake and Jeter came from The Biomechanics Research Project in the IAAF World Championship Daegu 2011 and was headed by the Korean Society of Sport Biomechanics. Data for Bolt came from a study authored by Mackala Krzysztof and Antti Mero, A Kinematics Analysis of Three Best 100 M Performances Ever, Journal of Human Kinetics, volume 36/2013, pages 149-160. I am responsible for the graphing of this data provided in these other two studies. Dave Nielsen has been the head track and field coach at Idaho State University for nearly 30 years. In addition to Olympic Pole Vault Champion and former world record Stacey Dragila, Nielsen has coached multiple ISU athletes to All America status and Big Sky Conference titles. |


