|
By: Chris Wolfe - Louisville Male High School (KY) Originally Published in: 2020 Nike Coach of the Year Clinic Manual - by Earl Browning Thank you very much. I see that we have the soldiers in here tonight. I hope I can give you something that will make it worthwhile. If you are here at this clinic at 7:30 on Valentine's Day, then you can coach at Male. Seriously I am looking for an offensive line coach. I am going to talk tonight on analytics and stats. How many people here have heard about the five factors? My objectives tonight:
I picked this up about six years ago in a blog by Bill Conley. The blog was called "Football Study Hall." That is what I am going to use in my lecture. I am going to show you what we share with the players. I am going to show them the five factors of winning. This is what I am going to share with them on game day. We are going to talk about the previous game as to what we did right and what we did wrong. When you see the five factors you will have a better understanding of what we do. Why do we do this? This about how to find an edge or add some kind of impact on winning. The players find value in the five factors. But more importantly, this is for the coaches. It keeps us focused on what is important. I think this helps us to diagnose what our issues are. It helps you decide what to take out of the playbook and what to leave in. That probably boils down to the personnel. Two years ago, we had a quarterback that accounted for 51 touchdowns. He had 30 passing and 21 rushing. He could absolutely run the ball. He liked to run the ball between the tackles and liked to run over people. The next year we had a quarterback that had no arm strength and I would classify as slow. With him, we could not run the same offense. Traditional thinking tells us that the 98 percent winning reliability is the turnover margin. These are headlines from newspapers that I picked out.
That is what coaches think. This was back in the 80's and 90's mindset. I will show you why that is not the most important stat for winning games. If we study the NFL since 1950, if you win the turnover margin, you win 78 percent of the games. Would we take that? The statistic I am going to show you is 98 percent. I am not going to tell you until the very end. It is like a cliffhanger. Six or seven years ago, I am doing my off-season stats. There is so much information on the internet on the game of football. I came across this and was intrigued by it. You can really study the game. The five factors: College football's most important stat. College football comes down five basic things. Four of these you can control. Five Factors
In efficiency. we track it by downs. What is the efficiency on 1St down and so forth? When we talk about first down efficiency is it four or five yards on the first play? When we talk about big plays. we are talking about 12-yard runs and a 16-yard pass. I picked 16 to keep away from the confusion with penalties. The YPP stands for yards per play. We will talk more about that later. Today we talk about the red zone, which is from the 20-yard line to the goal line. Inside the 40-yard line is called the scoring zone. When we get inside the 40, I am talking to my OC and telling him to make good calls because we are in the scoring zone. That changes your mindset. We get points for possessions inside the 40-yard line. Another factor in scoring is the fact that not everyone has a kicker. Field goals are awful. There are only a few times you should kick a field goal. At least that is what the analytics tell us. I have a measurement where I weigh these facts and know whether I won the game. I know that fact already, however, I want to know the probability of me winning the game. If we played this game 100 times is my probability of winning the game 55 percent. When you look at the list, turnovers are low on the list. I am going to use the semifinal game in the state championship game as an example. The TC in the example stands for Tates Creek. That is the team we played.
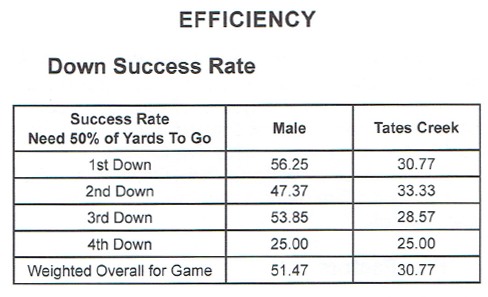
On the first-down play to reach the success rate you have to get 50 percent of the needed yardage. If you are first and 15 yards to go, for the first down, you have to pick up 8 yards. On second down the rate is 70 percent of the yardage to get the first down. The last statistic is the success rate of 1-4 downs. This is what we show the players and what we track. In this game on first down 56 percent of the time, we gained five yards. The fourth-down stat is skewed because the end of the game is garbage time. The situations that occur on fourth down late in the fourth quarter happen because of the score of the game. That means if you are ahead by three scores, on fourth and six instead of punting the ball, you go for it. They count but the situation is different in a close game with both first units on the field. The numbers I want to point out are the final stats. We were 51 to 30 on the down success chart. That is 21 percent more efficient than our opponent. We bring out the chart on an entire year of games. That could be 1000 games. This chart was a college chart, but we can use it.
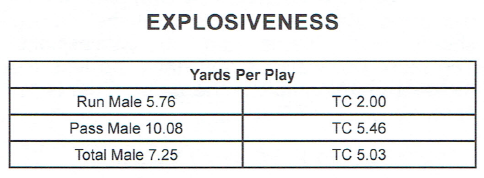
The chart comes from the composing of the college stats for the 2013 season. If you look at the first column the success rate is listed. This is an example of where the game I showed you would fit on the chart. The 21-point margin rate fits into the 20-30 percent block. The percent of games with a 20-30 ranking was 15.7 schools. That means it would be a 99.2 chance of winning the game. If you have a 21 percent winning margin, then you are winning. When you build your game plan, you are going to ask the question, where can we get five yards on first down? It becomes all about the efficiency number. We also put together a bar graph comparing numbers from selected years. We picked the years 2013-2018. 2018. and 2019 semifinal games in the state playoffs. In the overall stats. the 2019 stat at 51.47 was first, 2018 at 47.28 was second, and 2013-2018 at 46.41 was third. This gives an idea of how we are playing as related to how we were playing over the year. The 56 percent on first down established in 2019 is a great number and you can see how it compared with the multiple years of 2013-2018. I think the players can see that. If you want to give the players something to connect these stats to plays, here is how it work with your players. If you are teaching a bubble screen, we tell them how many yards the play should get. However, when we talk about the play being an efficient play, it has to gain five yards. The player is going to try to get five yards on the play. If he is going to be tackled, instead of taking that second juke step, he gets his pads down and tries to get the five yards. The same thing is true on a running play. The running back can turn a three-yard play into a five-yard play just by running behind his pads. That connects the stats to the players. We do the same thing with defense. That is it for efficiency but I am going to come back to it later in the presentation. This is my favorite. It is the one on explosiveness. On this, we are still comparing our 2019 game against Tates Creek.
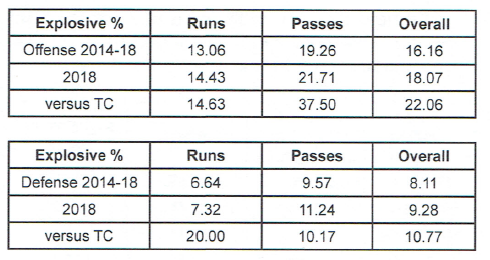
I am not in love with the yards per play. We use it because it fits into the calculations with your winning percentages. The one that is the big deal is the big play section. Big runs are 12 yards and passes are 16 yards. The +8 is a huge number. If you are +8 in explosive plays you are going to win. We had to find something that gave us a tempo model. In some games, we may run 25 plays and some we may run 70 plays. We needed to have something that factors in tempo. This chart gives you the percent of the total explosive plays. In the running game, 14 percent of the running plays were explosive plays. In the passing game, there was 37 percent of the throws were explosive passes. What you can see from this was that their defense geared up to stop the run and gave us passing opportunities. By looking at the charts, you can see where you were last year as compared to where you are this year. It gives you some context to what you are seeing here. As you look at the overall data, you can see that we were ahead of the historical data. That means you have had a good day. We do the same thing with the defensive side.
The next part is finishing, which is the scoring zone. FINISHING Points for possessions inside the 40-yard line
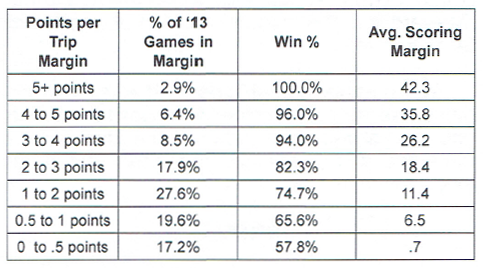
If we go back to the college chart, we can get the percentages and probability for our semifinal game with Tates Creek. Below is our line on the chart.
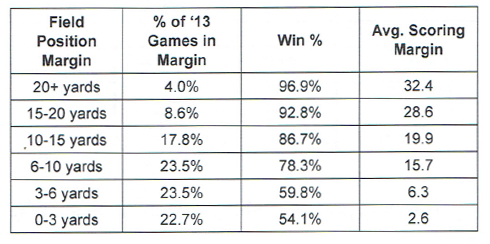
We had 2.4 points per trip into the scoring zone. For the 2013 year, 18 percent of the games were in that category and they won 83 percent of the games. The average scoring margin was 18 points. That is a pretty significant deal. If you go to the top of the chart, you will find the trips into the scoring zone was +5. That would be like a team getting into the scoring zone seven times to the opponents two. Their win percentage would be 100%. FIELD POSITION
The field position difference is 7 yards. That does not sound like much but if you multiply that by 13 possessions that amounts to 91 yards.
The chart said we had almost an 80 percent chance to win the game. That is a seven-yard difference in the field position game. That is why you spend time trying to keep the opponent from getting out to the 40-yard line. These figures guide me and my staff. From the statistics, we know what we have to do in each part of the game. It helps us focus on what is important. We talk about special teams in the field position part of the game. However, field position comes from fumbles also. If you fumble at your one-yard line and they score, that drastically affects your field position chart. The same thing is true if you intercept a pass and return it to the five-yard line. It is the start position of where that team begins. When we think about special teams too many times, we do not consider field position. When you look at the chart, you get the idea of how big a deal it is. Every little bit matters and at our level, it is razor-thin. TURNOVERS
Turnover winning percentage
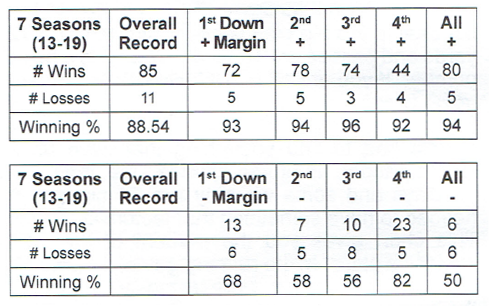
We had 37 games out of 82 with a positive turnover margin. The winning percentage for those 37 games was 94 percent. We had 19 games out of 82 with a negative turnover margin. The winning percentage of those 19 games was 74 percent. That is less than 94 percent and less than 89 percent. but 74 percent is not terrible. That means you turned the ball over to the opponent more than they did to you and you still won 75 percent of your games. Turnovers are not the gold standard winning stat, but still important. I played football in the '80s and started coaching in the '90s. Football was all about control of the ball and play great defense. The offense was primarily running the football. The philosophy shrunk the game down to a few positions. With fewer possessions, turnovers were extremely important. The game of football has changed. Teams are going hyper-fast. You saw in the statistic sheets, both teams had 13 possessions. The more possessions you have the less the turnover margin impacts the game. That is my analysis. Let's go back to Efficiency Margin. Efficiency Winning Percentage
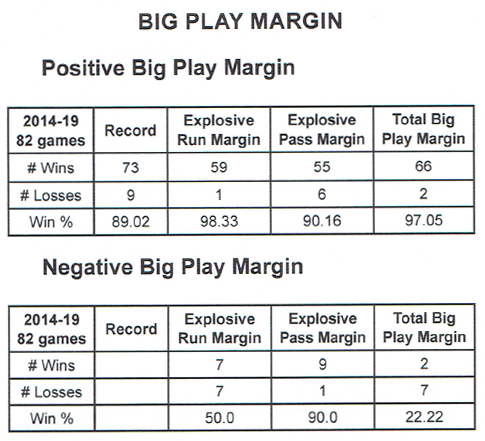
During that period, there were 12 times when our overall efficiency rating was negative. That means the other team had a higher efficiency rating. We only won 50 percent of those games. When we had a positive efficiency rating, we were 94 percent. The turnover margin was better than efficiency percent. The turnover margin was 94 and 74. The efficiency percent was 94 and 50. Efficiency is more important than turnovers and turnovers somewhat involve a luck factor. Let us go to my favorite stat, big play margin, or explosive plays. The model is from a six-year period. We played 82 games. Our win/loss record was 73-9. When we won the big play stat, we won 97 percent of the games. In nine games we had a negative big play statistic. We won 22.22% of those games. That is a huge drop, 97 to 22 percent. That is an incredible number. Explosives is where its at!
Next is the magical stat that we have discovered. I combined explosive plays and turnover margin and created a hybrid. I called it TEX margin or turnover/explosive. When we were positive in turnovers and explosive plays, we won 98.5 percent of the time. We only lost one game. That is a huge number coming out of a good sample size. When you put the two together it amounts to almost 99 percent wins.
This number still includes turnovers, but using just explosive plays is still better. Putting the two together, the numbers don't lie. Category winning percentage based on typical college football season. This is from SBNation, Football Study Hall.
Those are college numbers. If you went to this website this is what you would find in their college predictions. The website is a little more advanced than me. What I have makes sense to me. He uses every yard line on the field and gives it a numerical value. You can see how we do explosives and turnovers. We use the big play margin. I did not mention that we view a special teams score as a big play. We also count defensive scores as big plays. We are starting to give points for explosive plays. For every explosive play, we get 4.5 points. For every explosive play we give up we give 2.5 points. Before I finish, I want to show you a snapshot of our playbook.
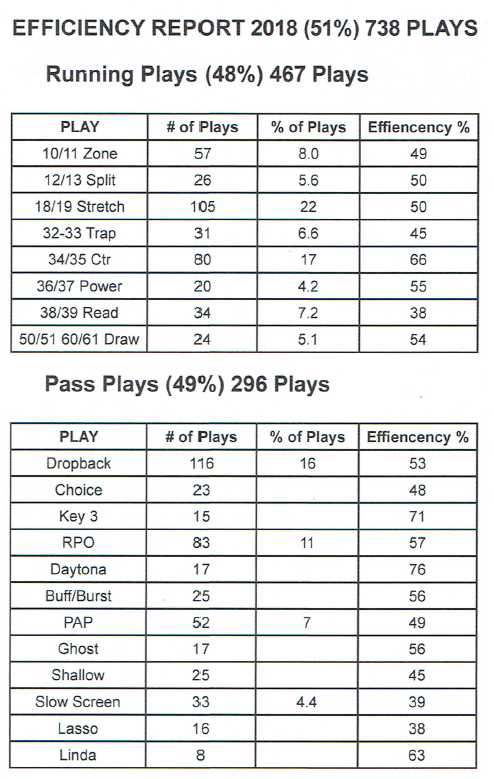
These charts are in our playbook and each year we change them. We have the calls and the efficiency rating for each one. Each year we change the playbook and add the previous season. This year we averaged 55 plays per game. Each year I need guard rails for this. I am adding and taking out. That allows you guidelines instead of just chasing butterflies. We can also use the charts for explosive plays. When we do that, we use the yards per play statistic and the efficiency rating. I also use the same type of chart but instead of efficiency. I use yards per play. Last year we had 5.62 yards per run. We had 9.48 yards per play passing. The 38/39 read play was the play we ran the year before, when we had a running quarterback. We did not run it one time this year. Our quarterback did not fit the play. I think I did good. I am right on the money for time. I earned my money tonight. If you have any questions to ask. I will hang around. Thank for your attention. |


